Green Energy
Aerial data for solar farms and wind installations, covering panel-level thermal condition, blade and tower integrity, vegetation encroachment and portfolio-wide performance tracking.
Full-site thermal audits and panel-level defect detection replace manual walkthroughs and rope-access campaigns. Hotspots, failed diodes, PID degradation and cracked cells are flagged panel by panel, giving your team an exact location instead of a general area to search. Blade damage is classified by severity too, with each crack or erosion mark carrying its own urgency rating.
RTK-precision flights map every panel to the centimetre, so each finding points to one exact panel, not a rough estimate. Findings are classified, geo-tagged and delivered straight into your platform, ready to act on.
Thermal audit at panel level
A ground-based thermal camera only covers one row at a time, so a full walk of a utility-scale site takes days and usually happens once or twice a year at most – leaving a hot cell or a failing bypass diode months to keep degrading before anyone notices the output drop.
Every panel is captured individually with RTK-geolocated thermal imaging in one site-wide flight, so a temperature anomaly is pinned to one exact panel and string, not flagged as "somewhere in this row.
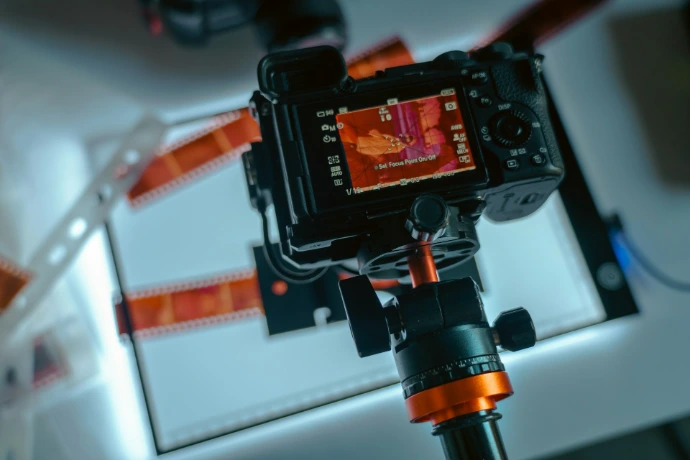
Full-site thermal survey
A complete thermal pass across the array, run ahead of peak generation season or on a recurring schedule, giving a baseline temperature reading for every panel on site.
Recurring seasonal audit
Scheduled thermal flights repeated at the same time each year build a comparable record, so a new hotspot or a worsening one stands out against last season's data.
Automated defect detection
Reviewing thermal footage frame by frame to spot a hotspot, a string outage or early PID degradation is slow and inconsistent — two people looking at the same footage can flag different things, and a subtle temperature anomaly is easy to miss across hours of raw video.
Thermal signatures are checked against known defect patterns automatically, so hotspots, string outages, PID degradation and diode failures are flagged the same way every time, with no footage left unreviewed.
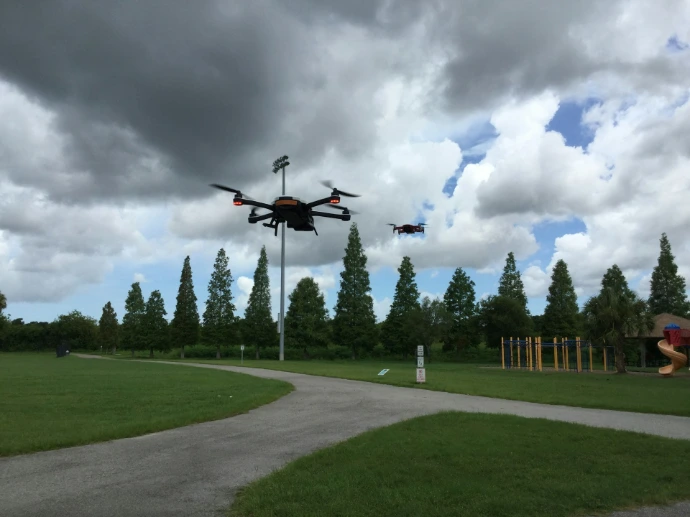
Blade condition survey
Full-span imaging of every blade flags leading-edge erosion, cracks, delamination and lightning damage, geo-tagged to the exact section, supporting repair-versus-replace decisions instead of a general "needs attention" note.
Post-storm & lightning damage assessment
A rapid-response flight documents blade and tower condition within hours of a storm or a suspected lightning strike, before restart or repair, giving insurers and OEMs a timestamped, defensible record.
Optical condition audit
Soiling, shading and cracked glass rarely trigger an alarm on their own – they quietly reduce output panel by panel, and a routine walk-through only catches what's visible from ground level or from directly in front of a row.
High-resolution optical imagery captures every panel from directly overhead, so soiling patterns, shading sources and physical damage are identified and geo-tagged panel by panel, not estimated from a row-level glance.
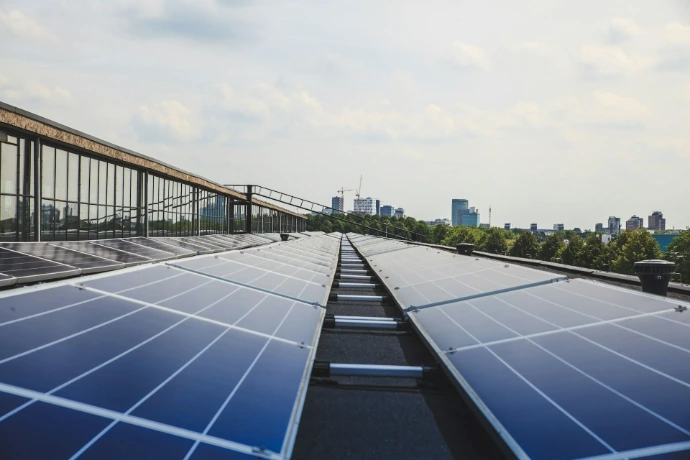
Soiling & shading assessment
Dust, dirt and shading from nearby structures or vegetation are mapped across the site and ranked by how much output each is costing, so cleaning and trimming get prioritised by impact.
Physical damage inspection
Cracked glass, delamination and frame damage are identified panel by panel, flagging what needs replacing now against what to monitor at the next inspection.
Day-zero commissioning report
A defect that ships past the acceptance certificate becomes the operator's problem, not the installer's – and a manual walk-through before handover rarely catches wiring faults or micro-cracks that only show up once the array is under load.
A full site inspection runs before sign-off, so installation defects are documented and geo-tagged while responsibility is still with the installer, not discovered months later at the first scheduled maintenance visit.
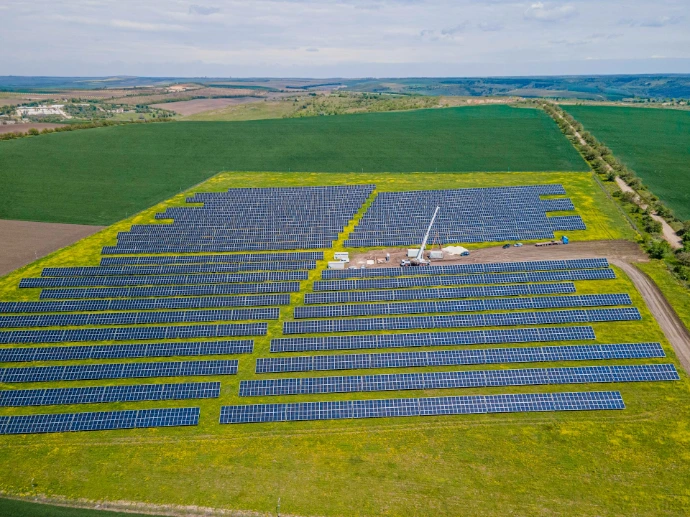
Pre-energization inspection
Wiring faults, connector issues and installation defects are checked across every panel before the system is switched on, catching problems before they cause a fault under load.
Acceptance documentation
A geo-tagged, panel-by-panel record is delivered ahead of sign-off, giving the operator a defensible baseline to hold the installer to before the warranty clock starts.
Why we're not just another drone company?
Faster turnaround
Findings are delivered within hours of a flight, not days after a manual audit and its written report.
Zero operational downtime
Flights are scheduled around live loading, unloading and vessel movements, so a survey never forces a pause in operations.
Direct system integration
Results are delivered straight into the WMS, ERP or GIS platform already in use, with no manual re-entry or separate report to file.
Full-site coverage in one flight
A single flight covers structural, thermal and volumetric checks across an entire site, replacing several separate manual walkthroughs.
Verified, audit-ready figures
Volumetric and condition data is accurate enough to support billing, inventory reporting and insurance claims.